Have you ever wondered how e-commerce websites get real-time and concrete insights into their business? It is nothing else but, google analytics! Google analytics is a well heard and known term, especially amongst e-commerce websites and entrepreneurs. Google analytics for website is essential to understand your customers’ behavior, habits, activity and their perception of you. In this post, learn the basic parameters to consider while analyzing your website using google analytics.
What is Google Analytics?
It is evident that if you own any business online or offline, you are keen to understand your consumers’ behavioral patterns, preferences, attitude, and choices. In case of a physical store, you can personally observe your consumers’ behavior. But if you host a business online then, you might want to use google analytics for website to know your consumers’.
For an online business, the valuable insights which are available at your fingertips include:
- Your site interface
- Customer behavior
- Where do they come from, etc.
How to Add Google Analytics to Website?
To get the most out of this post, you first need to set up a google analytics account. Here’s the step-by-step process to create google analytics for website:
Step 1: Go to google analytics, create a new account, select your website URL and fill in other required details.
Step 2: You will get a tracking ID for your tracking code. Which will more or less look like –
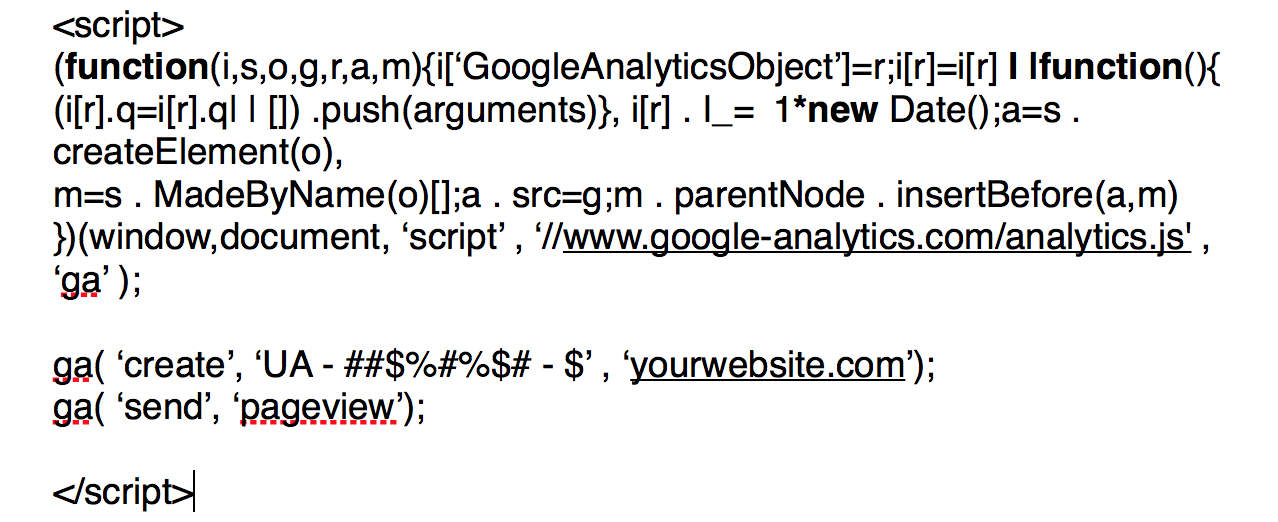
Step 3: The above code needs to be pasted in the next window, go to settings, turn on the e-commerce tracking feature and click on save. It might take 24 hours for google analytics to start collecting information. Once your account is active you can start viewing business reports.
Welcome to google analytics for website dashboard!
Note: Here you only see the big picture and not the underlining currents which contributed to the reports.
In order to make accurate business-centric decisions, all need to look at is –

These tabs appear on the left panel of your dashboard. They need to be your main focus points at first. You will be more confident and pro to surf other reports in analytics once you master these basic ones. Before you go deeper in the reports, remember to set the desired date correctly in the top right corner.
Google Analytics For Website Reports
Real – Time Report
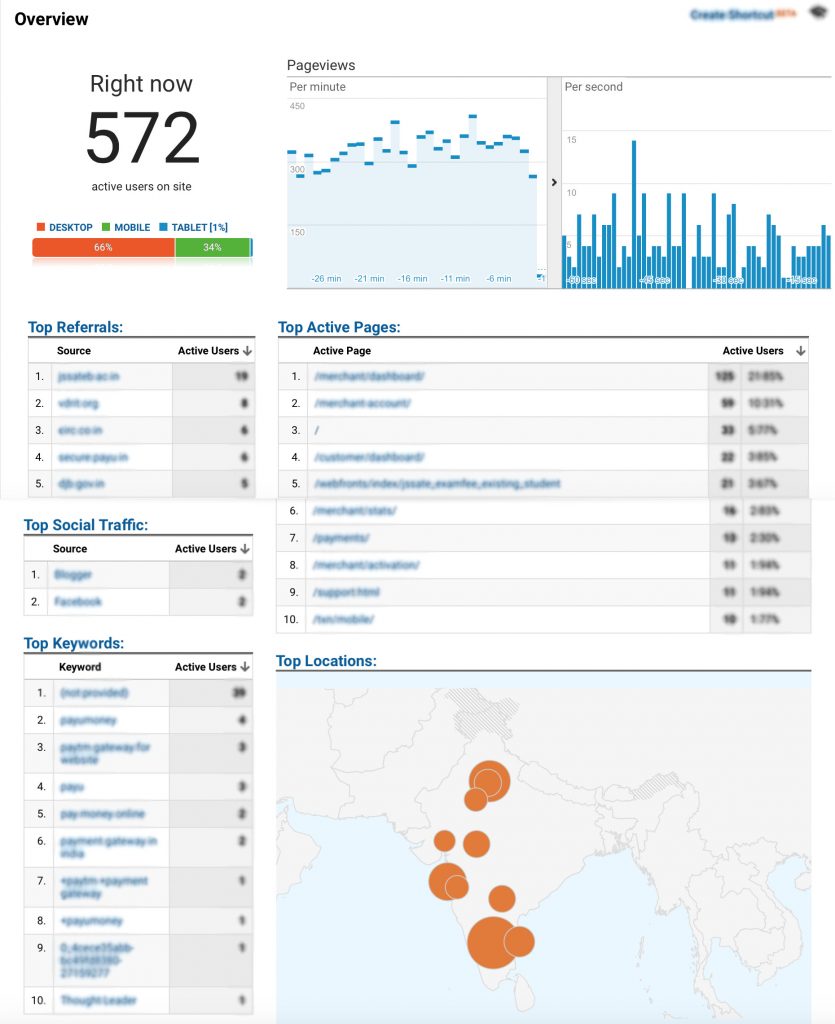
*Information in the image is blurred for privacy purpose.
It simply projects all activities happening on your site. It is a great tool to monitor website traffic in depth – who is on your site at that very moment, their geographic location and pages they are browsing.
A real-time report is mainly useful for pulling out the email, blog, social media or campaign performance. Also, for tracking them on the spot impact of traffic on your site. You can utilize this information to make better marketing and promotional decisions for your business.
Audience Report

It tells you more about who is on your website. This report provides in-depth insight into the age, gender, geography, language, device used (desktop, mac, mobile, etc..). You can figure the total number of visitors on your site (sessions), new & returning users.
Simple terms explained:
Sessions: A group of on-site activity a user makes within a given time span. A single user can open multiple sessions at the same time.
Users: Total unique visitors to your site. There are two types of users: new and returning. Google analytics creates a unique id for every new user (desktop, mobile, etc..). Thus if your id is 01 you are a new user (desktop). If you go back to the same site again then you are a returning user. But if a different device is used (mobile), then your id will be 02 (new user).
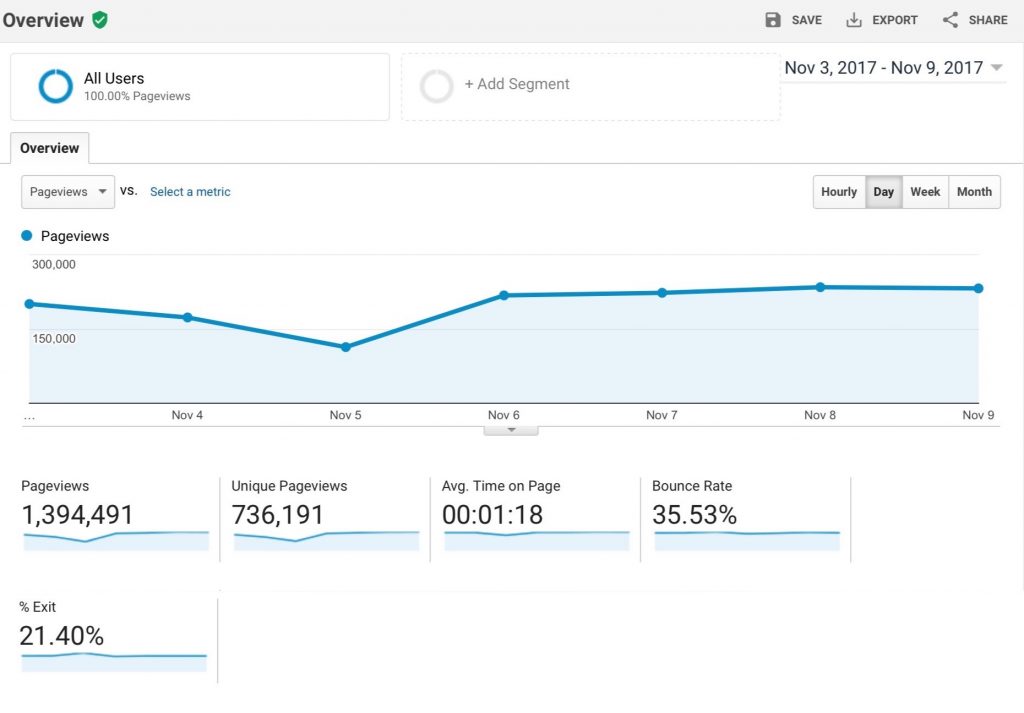
Page views: It is the total number of pages viewed (loaded or reloaded).
Pages/Sessions: The metric page per session is the average number of pages viewed in a session.
Avg. Session Duration: It refers to the average amount of time your visitor stays on your page.
Bounce Rate: Percentage of visitors who view only one page of your site within a stipulated time period. There is no further activity performed by the visitor which leads to session expiry.
You can change or add segments as well in this section. By adding an additional segment you are opening your analytics ground a bit more by comparing two segments. For example, you can compare people who bought your product and people who didn’t buy the product in order to understand the difference between them.
You can make use of this information to:
- Understand people from which country, state and city are viewing your website and are interested in it. This will help you to cater to these specific audiences by creating campaigns or communications meant for them. For example, shipping costs, sales, and so on.
- As you know which device (mobile, desktop, android, mac, etc.) is popular amongst your audience you can optimize your site accordingly.
Acquisition Report

This report projects how your visitors and users found and arrived at your website. From where did they arrive at your website? Which other sites got them to yours? What distribution strategy is working and what is not is highlighted here. Apart from acquisition overview, Referrals helps you to understand which pages and domains are linking to your store and directing traffic.
Behavior Report
The behavior report tells you the improvement areas in your content and how your visitors are reacting to it. Bounce rate, page load time, unique views are captured here. This report will help you improve your customer experience on your site thus increasing conversions.
Conversion Report
The Ecommerce tab under conversion is the reason why you turned on the E-commerce tracking initially while signing up. Here google analytics tracks your product, transactions and time of purchase on the basis of the information it receives. These insights help you understand which product is liked by and suited for your customers.
Google Analytics for Website Campaigns
![]()
One of the most important things to track in analytics is your marketing efforts in the form of campaigns. So how do you track your campaigns? Just with a link! Google analytics facilitates you to quickly create and automatically track campaign specific special URL. To track campaigns automatically all you have to do is log on to Google’s campaign URL builder tool.
You need to paste your website link and provide some relevant information asked. Once this is done, Google provides you with a complete trackable URL. This URL can be used wherever you wish to promote your product or site. Google will automatically recognize the link and track all the actions performed by the user. These searches can be viewed in the Acquisition – Campaigns tab.
Most people find google analytics for website very difficult to use or understand because of all the jargons used in its reports. However, to grow your user base and business further, understanding these simple basics of your online business and audience is crucial.
It’s time to start your online business with PayUmoney!


Leave a Comment